在移动H5使用了 ECharts 开发可视化图表,遇到一个特殊需求:折线趋势图中需要默认展示最后一个坐标轴对应的数据,也就是主动触发 tooltip 的展示。
一、组件解释说明
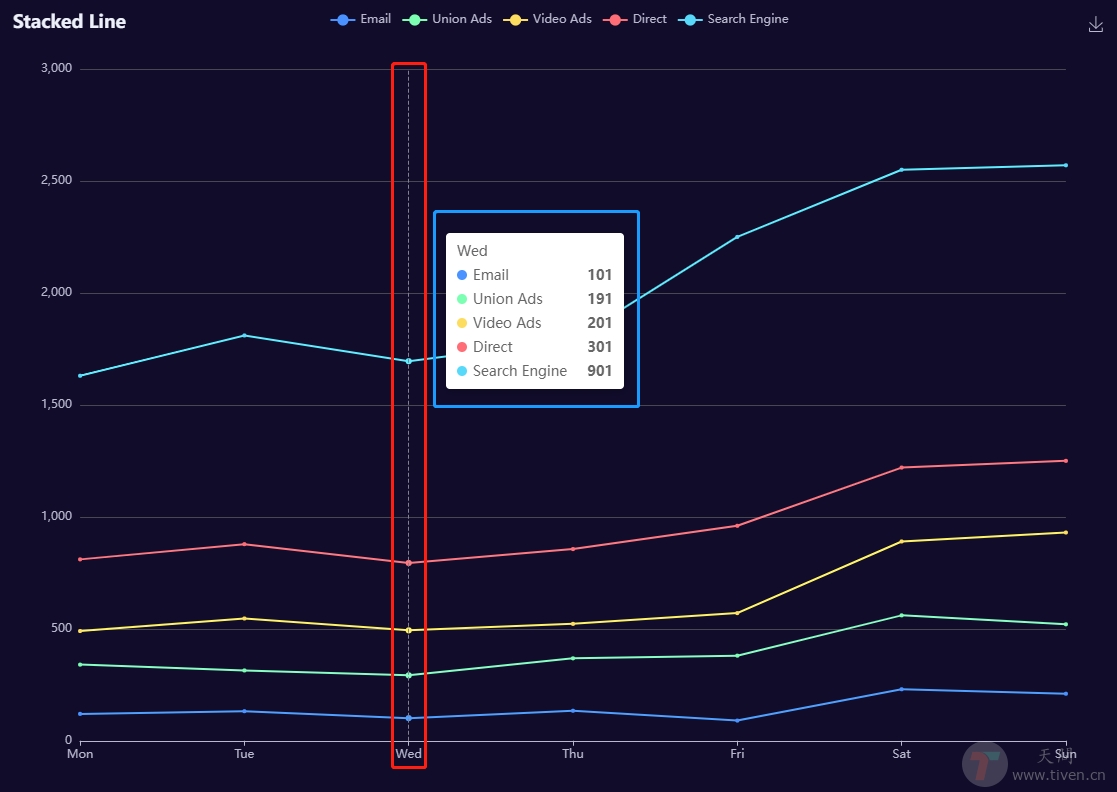
- axisPointer 是坐标轴指示器,上图 红框 中展示部分。
- tooltip 是提示框组件,上图 蓝框 中展示部分。
二、ECharts API
- echartsInstance.dispatchAction: 触发图表行为,例如图例开关
legendToggleSelect, 数据区域缩放dataZoom,显示提示框showTip等等 - action.tooltip: 提示框组件相关的行为。
- showTip: 显示提示框。
- hideTip: 隐藏提示框。
- action.axisPointer: 坐标轴指示器配置项相关的行为。
- updateAxisPointer: 更新坐标轴指示器。
API使用说明:
1 | |
三、使用示例
在 Vue 项目中使用:
1 | |
欢迎访问:天问博客
本文作者: Tiven
发布时间: 2022-08-17
最后更新: 2023-07-17
本文标题: 移动端echarts手动控制tooltip和axisPointer的展示隐藏
本文链接: https://www.tiven.cn/p/128b362f/
版权声明: 本作品采用 CC BY-NC-SA 4.0 许可协议进行许可。转载请注明出处!
发布时间: 2022-08-17
最后更新: 2023-07-17
本文标题: 移动端echarts手动控制tooltip和axisPointer的展示隐藏
本文链接: https://www.tiven.cn/p/128b362f/
版权声明: 本作品采用 CC BY-NC-SA 4.0 许可协议进行许可。转载请注明出处!
'%3E%3Cpath fill-rule='evenodd' clip-rule='evenodd' d='M33.232 28.434a2.5 2.5 0 001.768.733 1.667 1.667 0 010 3.333H5a1.667 1.667 0 110-3.333 2.5 2.5 0 002.5-2.5v-8.104A13.262 13.262 0 0118.333 5.122V1.667a1.666 1.666 0 113.334 0v3.455A13.262 13.262 0 0132.5 18.563v8.104a2.5 2.5 0 00.732 1.767zM16.273 35h7.454a.413.413 0 01.413.37 4.167 4.167 0 11-8.28 0 .417.417 0 01.413-.37z' fill='%23BDC4CB'/%3E%3C/g%3E%3Cdefs%3E%3CclipPath id='clip0'%3E%3Cpath fill='%23fff' d='M0 0h40v40H0z'/%3E%3C/clipPath%3E%3C/defs%3E%3C/svg%3E)